To the drawing board: donuts, stacks and nets
This post documents the outcomes of the breakout group that worked on drawing visual metaphors for the reframing (Judith, Marleen, Alek, Aral).
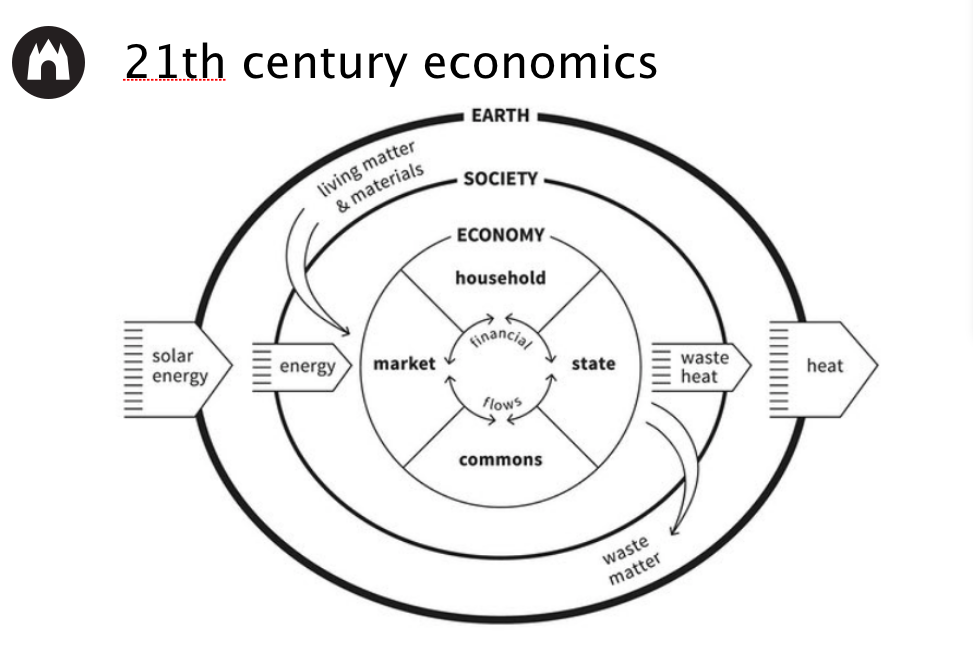
Doughnut economy
The Doughnut economy model, together with its visuals, remains for us a point of reference for succesful policy framing. We like the way in which this model presents a completely new way to look at society and economy, while retaining the idea of the market as a constituent part. We like it also for the fact that it explicitly includes the commons as an element on par with the market. Finally, we appreciate its strong visual metaphors, based around the concept of a doughnut.
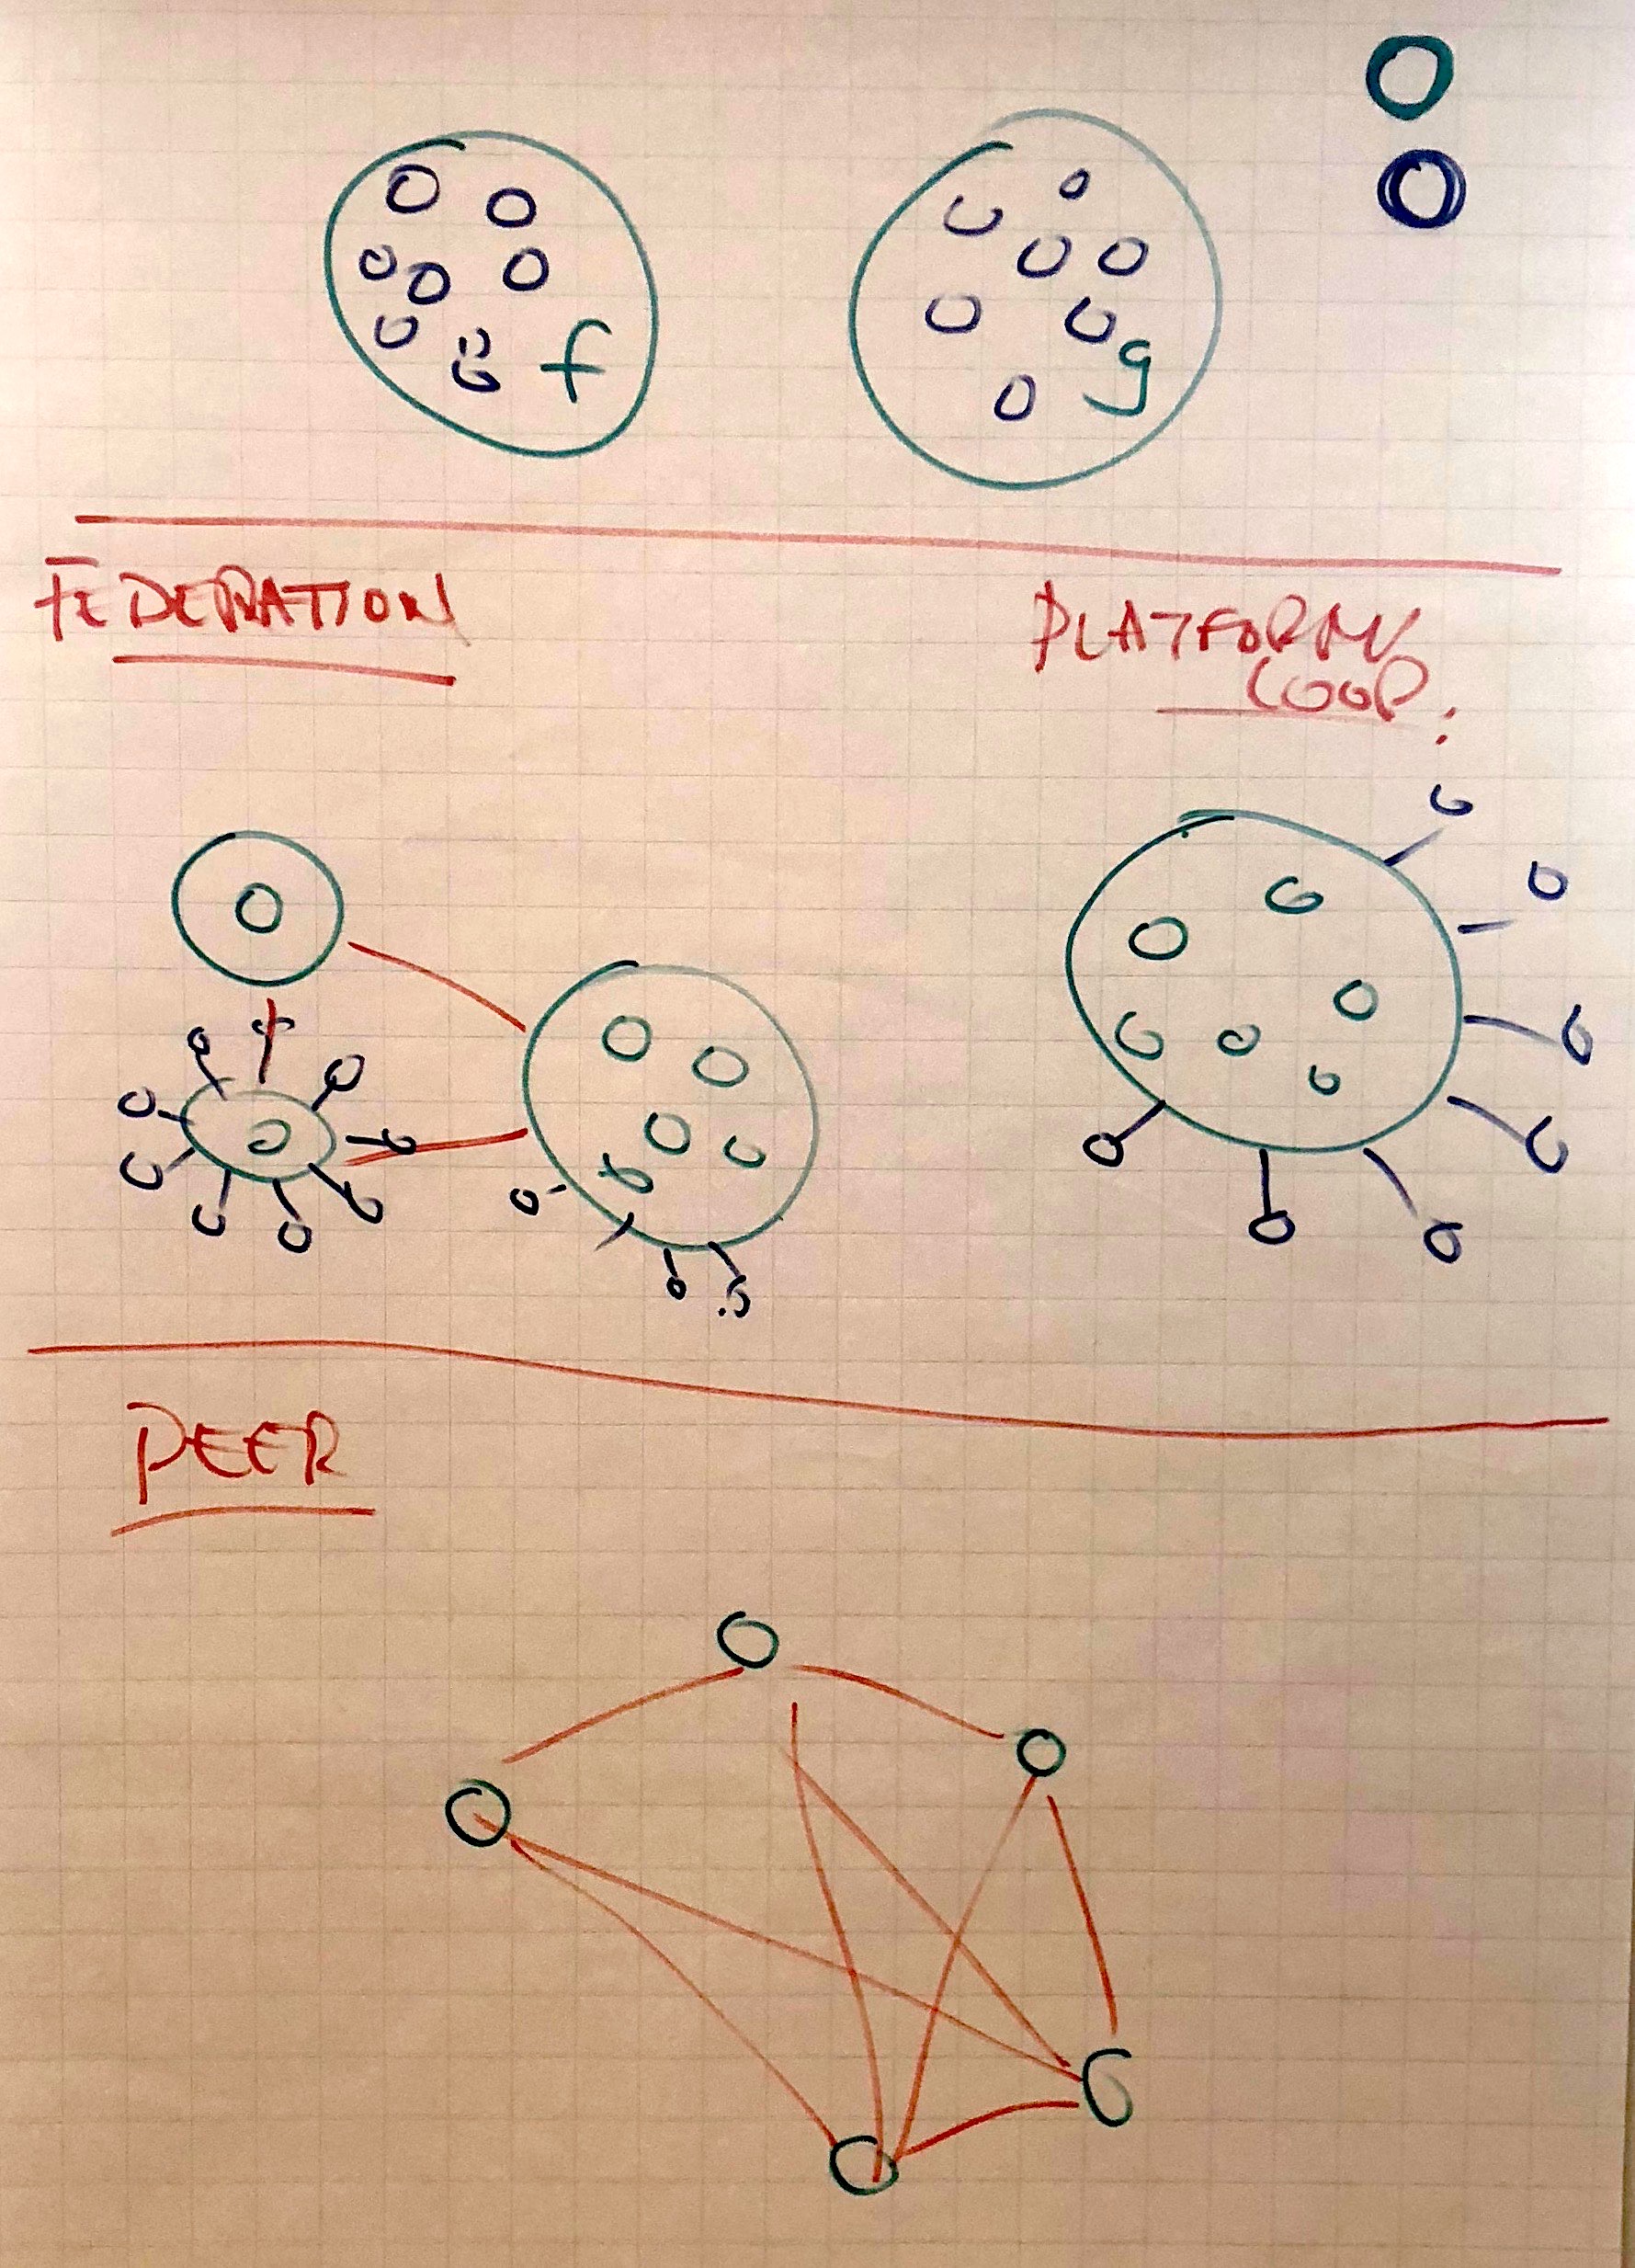
Decentralization
Decentralization can be well explained through network diagrams that go back to Paul Baran's diagrams that illustrated the principle of the decentralized network. In thinking about decentralization, we should consider a long tradition of efforts to decentralize communication.
In our session, Aral Balkan presented a simple graphic that visually illustrates possible forms of (de)centralization of communication.
Stacks
We have been working with an implementaton of the stack metaphor developed by Waag during the Public Stack Summit. The stack metaphor has been used to present a layered view of technological systems, and more broadly of the society - in order to describe, for example, appropriate regulation of different levels / layers of the stack.
The stack metaphor can be used to describe in more detail the new digital policy frame - by demonstrating changes occurring at different levels of the stack.

Other ideas
- The Energy Efficiency Rating icons can be a point of reference for developing a similar rating scheme that would measure to what extent a given process or project is commons-based.
- Taking as a basis the doughnut model, which presents an equilibrium between market, state, commons and platform, we can build a "speed linit" visual that measures the proportion between market and other forms of (broadly understood) coordination, and puts a "speed limit cap" on the domination of the former.